
Tips for assessing last season and planning next season, Part one
/Whatcha’ gonna do with all that data? Use it to plan next season, of course.
We log workout data, and some of it never sees the light of day again. Whether you like the old school pencil and paper method or the website technology of Strava, Garmin Connect, Mapmyrun, or others, it’s worth reviewing from time to time. I favor the digital side. Mostly because it makes the math easier and I can make some pretty sweet maps and graphs afterward. There are few things I appreciate more than maps and graphs.

My 2016 running heat map
So why are you really tracking all of this information? Most would say to allow the ability to see when they are improving. Bingo. But there are a few more reasons to keep track of and analyze the information regularly.
- Increase the chances of short term and long term success
- Compare real objective measures to what you *think* is going on
- Improve your time management
- Determine where injury or overtraining may have occurred (a breaking point)
- Determine whether you met your full true physiological potential (or if you were just slacking off)
- Make it easier for a coach to analyze (currently or on down the road)
- Remind yourself of events and workouts you never want to do again
- Remind yourself of events and workouts you would love to do again
- Determine overall strengths and weaknesses
- Prevent burnout
- Define reasonable future goals
- Recognize any past goals met
- Discover what aspects of training and competing are really important to you
I started keeping a training log when I was around 15 years old.. Too bad they didn’t have these new-fangled wrist-worn GPS devices back then. There was more guesswork at distances and paces, especially because I was just making courses up. And sometime in college I tried logging everything into a Microsoft Excel spreadsheet, but that felt too cumbersome. Somehow, there are people still doing this! I salute your ability to tolerate the pain delivered from the software equivalent of a Ford Model T.
A spreadsheet isn’t specialized in its design, but it has the potential to be more informative than a paper logbook. Now the GPS watch companies produce some pretty decent metrics and there is additional software like Golden Cheetah and websites like Training Peaks that gobble up and produce more information than anyone can ever want or use. I love it.
At the least, take a look back at these basic measures:
- Total yearly time
- Total yearly distance
- Average daily, weekly, monthly, yearly mileage
- Average daily, weekly, monthly, yearly pace/speed
- Competitive performance times, distances, paces
If there is one thing I can emphasize, it is that you should pay attention to trends, not single workouts, weeks, or even single months. Success is not built upon these brief intervals of time, nor is failure. Most injuries are not the result of what happens in a short period of time either.
Monitor the trends of speed, mileage, and duration for each week, month, and year. Following these trends, you can determine if there is consistent improvement or recognize unexpected losses before it is obvious in your performance.
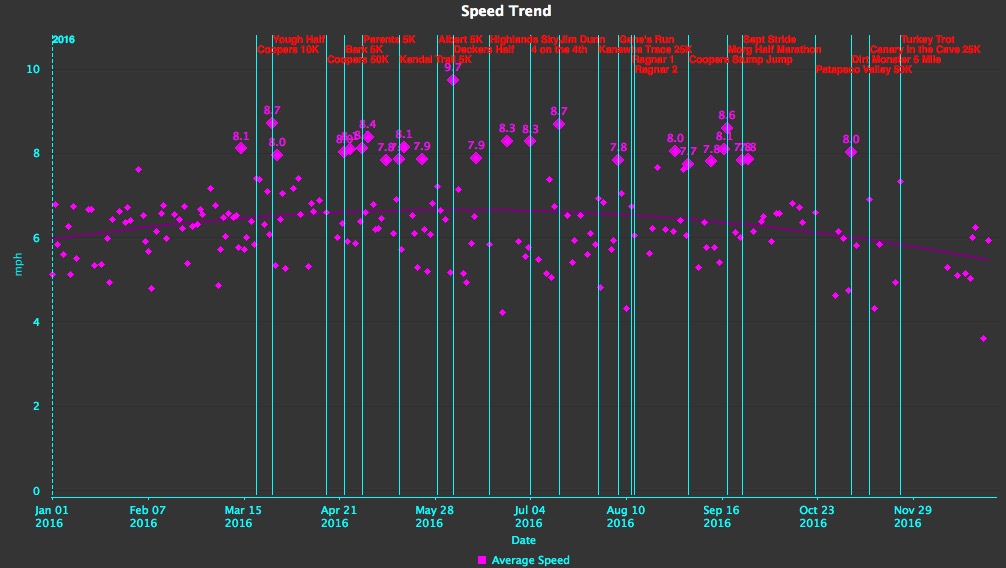
Average speed across 2016. Trend line peak coincides with June event where I wanted a best performance.
Solely considering mileage, sure, you can progress each week greater than the generally recommended 10%, but should you do it for several weeks in a row? Most people are not going to withstand those increases. If you don’t look at the long-term trends, then you may just very well forget that you progressed 30% in volume for two weeks in a row just a month ago.
The same would apply to the quantity of high intensity work. Progressing too rapidly in the volume of intense exercise can be a problem, even if total amount of time or distance stayed the same from one week to another. Progressing too rapidly will eventually cause a problem one way or another.
Were you injured this year? Compare the time frame where you were injured to the time frame just prior to injury. Was there a fluctuation in intensity or in mileage volume? Maybe it’s something you can’t quite put your finger on.
That’s when you realize that miles, pace, and distance do not tell a full story. This is where more advanced measures become helpful. These advanced measures are likely to be most beneficial to an athlete that is trying to make a large amount of progress or achieve their peak fitness:
Fatigue points
- In terms of time, where did you begin to bonk or have a drop of pacing? Where did you think “this stinks” or begin to mentally struggle with the work being done?
- These points are commonly where technique breaks down. It’s good to have a specific goal for when these moments arrive. For instance, if you know your cadence starts to slow, let’s say to 165, then focus entirely on keeping it higher, like 175.
- Mimic these moments in training in order to determine the resolution that allows you to avoid injury and performance decline. You will probably never fully avoid these points but with training you can keep shifting them further away to prolong the time before trouble strikes. Of course, this is dependent on other factors that would need to be duplicated, like speed and distance. With that in mind, this clearly isn’t something you would try to work on everyday.
Acute:Chronic Workload Ratio
- Calculated as the most recent weekly mileage or duration divided by weekly mileage or duration total during the last 4-8 weeks. This is a newer consideration, yet so simple. It was introduced in the 2015 research with a study on rugby players. They found that having a high ratio of 1.5 or greater was a associated with onset of injury. Interestingly enough, a ratio of 0.85 to 1.35 was found to be protective to injury acquisition. Even though the research was done on rugby players, it’s easy to calculate, so I would suggest applying it to your training if you can measure volume. The result is similar to a 10% weekly progression.
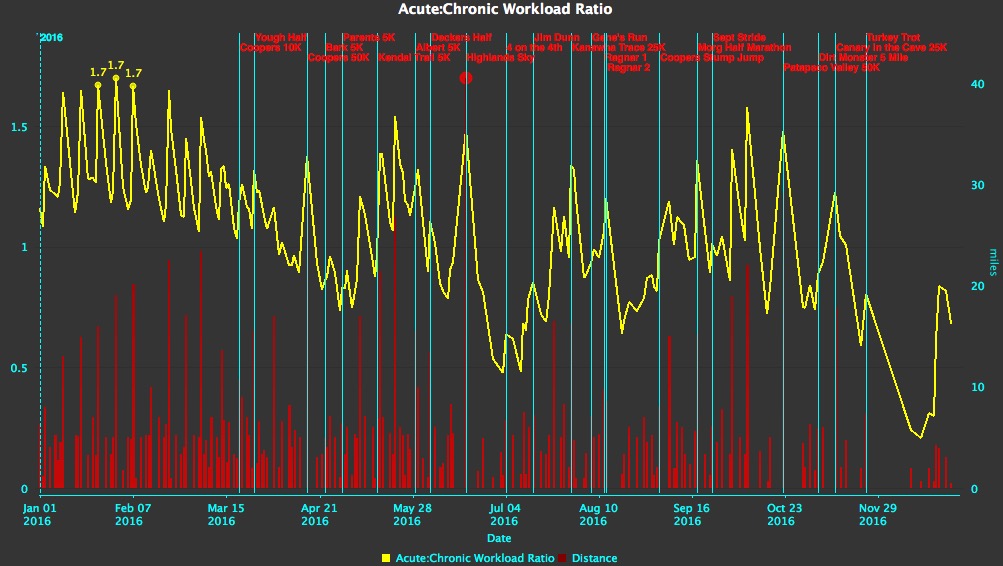
Pressing my luck with an acute:chronic workload ratio of 1.7 for a little while there.
Average daily, weekly, monthly, yearly heart rate
- Yes, I know heart rate isn’t the most fabulous measure. But if you are using only the basic metrics, this is a good place to start because devices are now measuring heart rate at the wrist and the chest straps are way more comfortable now than 5 years ago. Trends in heart rate can demonstrate overtraining habits or improvements in performance. For instance, if I am ramping up my base miles I can compare performance on a certain loop at the same pace/time and might see a lower average heart rate for the same speed.

Average heart rate was at its lowest while heading into June as well.
Elevation gain/loss
- Someone unfamiliar with the impact of elevation might mistakenly call an average pace of 10 minutes/mile “slow.” They aren’t accounting for the fact that the average mile climbed was 200 feet. This is the main reason I do not believe in online running pace calculators for training or competing on hilly terrain. This is why power will be a much better measure of effort and stress. So...
Power
- A newcomer to the running world. Just give it a couple years and many of you will have power data on your fancy GPS watches.
- Although the current power meters for running don’t directly measure the force produced by your body, it’s still more accurate than guessing based upon how you feel.
With software like Golden Cheetah or Training Peaks, you could dive even deeper with these calculated measures:
Critical velocity
- Critical velocity is the pace that you could theoretically sustain for an indefinite amount of time. Training at or above critical velocity is one way to focus on becoming faster.
Training stress scores
- Training stress is a measure calculated by considering heart rate (as a measure of intensity) and time.
- Acute or short-term training stress (stress over the last 7 days) vs.
- Chronic or long-term training stress (stress over the past 42 days)
- Training stress balance is about managing the balance between the two in order to provoke higher competitive performances

Training stress graph for 2016
Next post I'll go over more planning tips. Please let me know if you have any questions at derek@mountainridgept.com.